Plotting data on the Circle
For the circle there are two different representations: as angles in the interval $[-π,π)$ or as complex numbers of absolute value 1.
The real-valued Circle
For signals on the circle, we can plot them in a usual scatter
using Manifolds, ManifoldMakie, GLMakie

M = Manifolds.Circle(ℝ)
x = 0:0.25:5
y = (mod.((x./2).^2 .- 0.4 .+ π, 2π)) .- π
y2 = (mod.((x).^2 .- 0.4 .+ π, 2π)) .- π

fig, ax, pl = lines(M, y; color = :green)
scatter!(ax, M, x, y2; color = :green)
fig
For images, we can also color them (automatically) in hue. Instead of using image(M, img) as the analgue of the above, we can also create a corresponding figure and axis and plot into this.
using Manifolds, ManifoldMakie, ManoptExamples, GLMakie

img = sym_rem.(ManoptExamples.artificialIn_SAR_image(128))
M = Manifolds.Circle(ℝ)
fig, ax, pl = image(M, img)
fig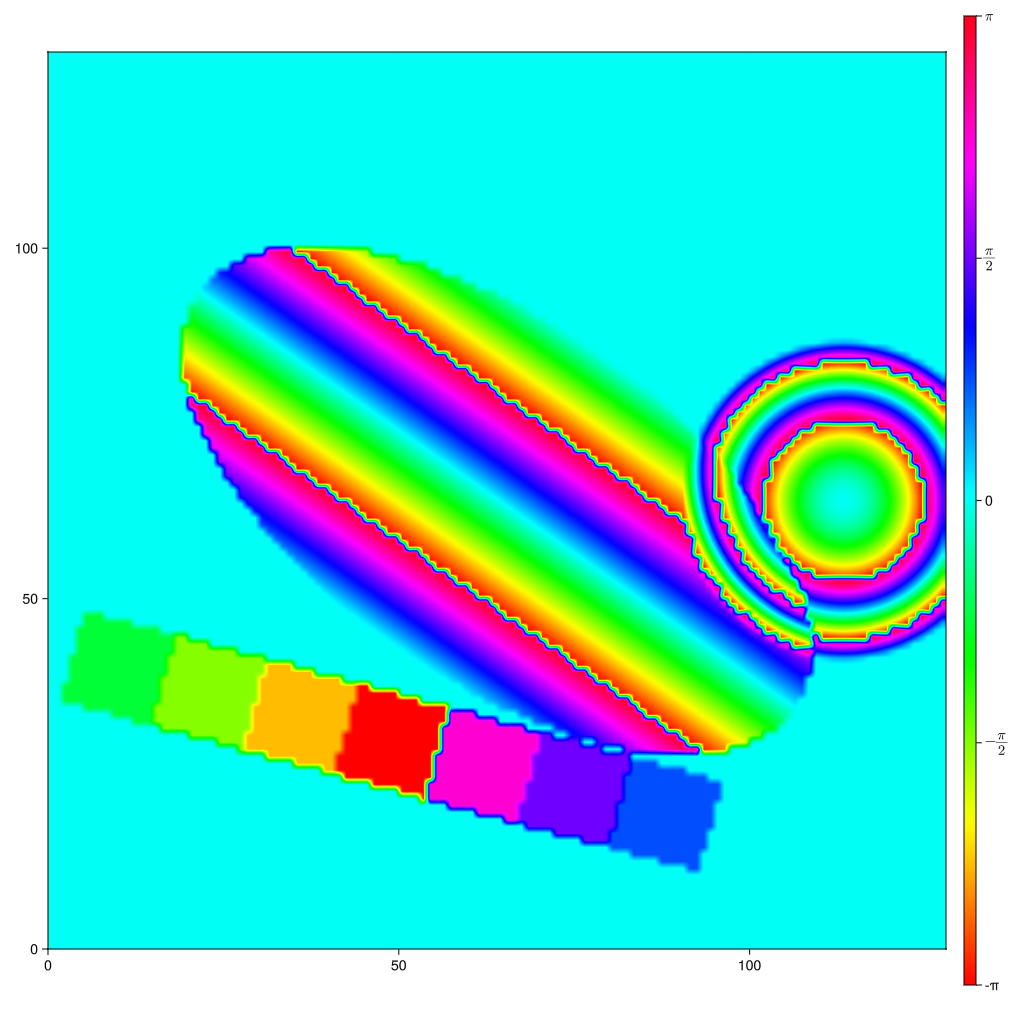
where the default colormap for these plots is changed to :hsv.
The complex circle
The complex numbers representing points on the circle in the complex plane can be used as follows
using Manifolds, ManifoldMakie, GLMakie

M = Manifolds.Circle(ℂ)
p = 1.0 + 0.0im
q = 1/sqrt(2) -1/sqrt(2) * 1im
r = 0.9 + sqrt(0.19)im
pts = shortest_geodesic(M, p, q, 0:0.05:1.0)
vecs = [log(M, s, r) for s in pts]

fig, ax, pl = arrows2d(M, pts, vecs; color = :blue)
scatter!(ax, M, pts; color = :green, markersize = 16)
scatter!(ax, M, [r,]; color = :orange, markersize = 16)
fig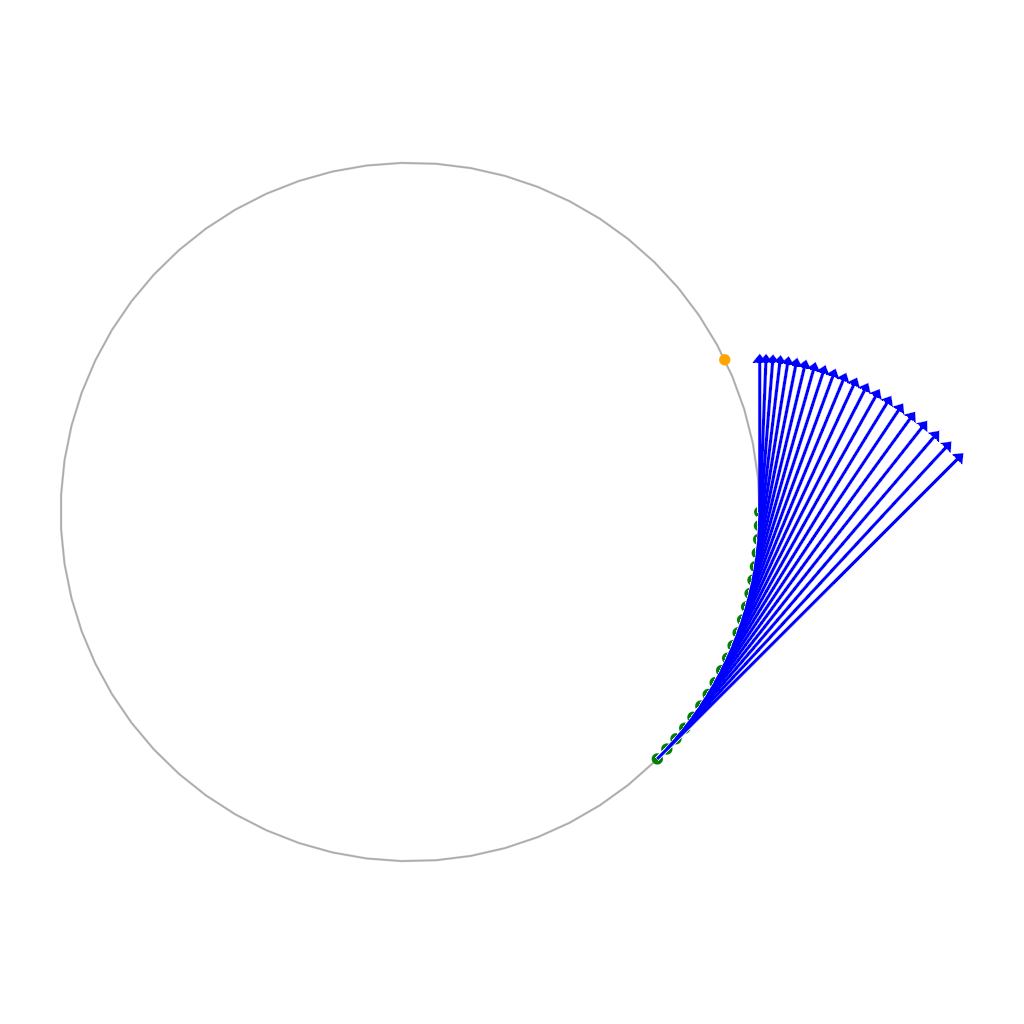
Function reference
ManifoldMakie.circleimage — Function
circleimage(::Manifolds.Circle{ℝ}; kwargs...)Start a plot for 2D data with values on the Circle represented in angles an interval [-π,π).
This can be combined with
image!(ax, M, img)to show the image of the data.
and is called if you call image(M, img) directly.
Examples
fig, ax = circleimage(Manifolds.Circle(ℂ))Plot type
The plot type alias for the circleimage function is CircleImage.
Attributes
clip_planes = @inherit clip_planes automatic — Clip planes offer a way to do clipping in 3D space. You can set a Vector of up to 8 Plane3f planes here, behind which plots will be clipped (i.e. become invisible). By default clip planes are inherited from the parent plot or scene. You can remove parent clip_planes by passing Plane3f[].
depth_shift = 0.0 — Adjusts the depth value of a plot after all other transformations, i.e. in clip space, where -1 <= depth <= 1. This only applies to GLMakie and WGLMakie and can be used to adjust render order (like a tunable overdraw).
fxaa = true — Adjusts whether the plot is rendered with fxaa (fast approximate anti-aliasing, GLMakie only). Note that some plots implement a better native anti-aliasing solution (scatter, text, lines). For them fxaa = true generally lowers quality. Plots that show smoothly interpolated data (e.g. image, surface) may also degrade in quality as fxaa = true can cause blurring.
inspectable = @inherit inspectable — Sets whether this plot should be seen by DataInspector. The default depends on the theme of the parent scene.
inspector_clear = automatic — Sets a callback function (inspector, plot) -> ... for cleaning up custom indicators in DataInspector.
inspector_hover = automatic — Sets a callback function (inspector, plot, index) -> ... which replaces the default show_data methods.
inspector_label = automatic — Sets a callback function (plot, index, position) -> string which replaces the default label generated by DataInspector.
model = automatic — Sets a model matrix for the plot. This overrides adjustments made with translate!, rotate! and scale!.
overdraw = false — Controls if the plot will draw over other plots. This specifically means ignoring depth checks in GL backends
space = :data — Sets the transformation space for box encompassing the plot. See Makie.spaces() for possible inputs.
ssao = false — Adjusts whether the plot is rendered with ssao (screen space ambient occlusion). Note that this only makes sense in 3D plots and is only applicable with fxaa = true.
transformation = :automatic — Controls the inheritance or directly sets the transformations of a plot. Transformations include the transform function and model matrix as generated by translate!(...), scale!(...) and rotate!(...). They can be set directly by passing a Transformation() object or inherited from the parent plot or scene. Inheritance options include:
:automatic: Inherit transformations if the parent and childspaceis compatible:inherit: Inherit transformations:inherit_model: Inherit only model transformations:inherit_transform_func: Inherit only the transform function:nothing: Inherit neither, fully disconnecting the child's transformations from the parent
Another option is to pass arguments to the transform!() function which then get applied to the plot. For example transformation = (:xz, 1.0) which rotates the xy plane to the xz plane and translates by 1.0. For this inheritance defaults to :automatic but can also be set through e.g. (:nothing, (:xz, 1.0)).
transparency = false — Adjusts how the plot deals with transparency. In GLMakie transparency = true results in using Order Independent Transparency.
visible = true — Controls whether the plot gets rendered or not.
ManifoldMakie.circleplot — Function
fig, ax = circleplot(::Manifolds.Circle{ℝ}; kwargs...)
fig, ax = circleplot(::Manifolds.Circle{ℂ}; kwargs...)
Draw a plot for data on the Circle. For the real-valued case this is a plot on an interval [-π,π), for the complex case a circle in the complex plane.
This is called when you use
scatter(M, pts)to plot points thereonarrows2d(M, pts, vecs)to plot tangent vectors (for the complex case)lines(M, pst)andscatterlines(M, pst)to signals (only on the real circle), where jumps larger than $π$ are not drawn
or can be drawn into with their mutating variant
Keyword Arguments
size = (1024, 1024)passed to the generatedFigurebackgroundcolor = :whitepassed to the generatedFigureaxis = Dict{Symbol, Any}()specify keywords to pass to the internalAxisfigure = Dict{Symbol, Any}()specify keywords to pass to the internalFigure
all other keyword arguments are passed to the internal plot! call, so they can also be used to modify the listed properties below – for the real-valued case, these are ignores, since there is no internal plot.
Examples
fig, ax = circleplot(Manifolds.Circle(ℂ))Alias
Figure(M; kwargs...) is an alias for this
Plot type
The plot type alias for the circleplot function is CirclePlot.
Attributes
alpha = 0.33 — Circle alpha (0 = transparent, 1 = opaque) in the complex case (Circle(ℂ))
clip_planes = @inherit clip_planes automatic — Clip planes offer a way to do clipping in 3D space. You can set a Vector of up to 8 Plane3f planes here, behind which plots will be clipped (i.e. become invisible). By default clip planes are inherited from the parent plot or scene. You can remove parent clip_planes by passing Plane3f[].
color = :black — Color of the circle in the complex case (Circle(ℂ))
depth_shift = 0.0 — Adjusts the depth value of a plot after all other transformations, i.e. in clip space, where -1 <= depth <= 1. This only applies to GLMakie and WGLMakie and can be used to adjust render order (like a tunable overdraw).
fxaa = true — Adjusts whether the plot is rendered with fxaa (fast approximate anti-aliasing, GLMakie only). Note that some plots implement a better native anti-aliasing solution (scatter, text, lines). For them fxaa = true generally lowers quality. Plots that show smoothly interpolated data (e.g. image, surface) may also degrade in quality as fxaa = true can cause blurring.
inspectable = @inherit inspectable — Sets whether this plot should be seen by DataInspector. The default depends on the theme of the parent scene.
inspector_clear = automatic — Sets a callback function (inspector, plot) -> ... for cleaning up custom indicators in DataInspector.
inspector_hover = automatic — Sets a callback function (inspector, plot, index) -> ... which replaces the default show_data methods.
inspector_label = automatic — Sets a callback function (plot, index, position) -> string which replaces the default label generated by DataInspector.
linewidth = 2 — line width of the circle in the complex plane (Circle(ℂ)))
model = automatic — Sets a model matrix for the plot. This overrides adjustments made with translate!, rotate! and scale!.
overdraw = false — Controls if the plot will draw over other plots. This specifically means ignoring depth checks in GL backends
space = :data — Sets the transformation space for box encompassing the plot. See Makie.spaces() for possible inputs.
ssao = false — Adjusts whether the plot is rendered with ssao (screen space ambient occlusion). Note that this only makes sense in 3D plots and is only applicable with fxaa = true.
transformation = :automatic — Controls the inheritance or directly sets the transformations of a plot. Transformations include the transform function and model matrix as generated by translate!(...), scale!(...) and rotate!(...). They can be set directly by passing a Transformation() object or inherited from the parent plot or scene. Inheritance options include:
:automatic: Inherit transformations if the parent and childspaceis compatible:inherit: Inherit transformations:inherit_model: Inherit only model transformations:inherit_transform_func: Inherit only the transform function:nothing: Inherit neither, fully disconnecting the child's transformations from the parent
Another option is to pass arguments to the transform!() function which then get applied to the plot. For example transformation = (:xz, 1.0) which rotates the xy plane to the xz plane and translates by 1.0. For this inheritance defaults to :automatic but can also be set through e.g. (:nothing, (:xz, 1.0)).
transparency = false — Adjusts how the plot deals with transparency. In GLMakie transparency = true results in using Order Independent Transparency.
visible = true — Controls whether the plot gets rendered or not.